Key findings
- Rides comprised a higher proportion of woodland area in game woods (13%) than non-game woods (8%).
- Ride canopy closure was 1.3 times greater in non-game woods.
- Erosion caused by vehicles was higher in game woods, but that caused by horse riding and footpaths was higher in nongame woods.
- Arable weeds and plants of high fertility and disturbed soil were more common along rides in game woods.
Rides typically comprise only a small part of most woods, but their value to wildlife can be disproportionate to the area that they occupy. Rides are often the only open areas for light-loving species and they tend to support different plants and animals from the rest of the wood. They are important in game management for access to release pens, feeding pheasants and standing the guns on shoot days. We sought to determine whether the density and structure of rides differed between woods with and without pheasant releasing. We also sought to examine any differences in the abundance and composition of the ride flora and butterflies.
We compared oak- and ash-dominant woods that contained pheasant release pens and had winter supplementary feeding with woods that had no recent history of game management (within the last 25 years). On the Hampshire and South Wessex Downs, we surveyed 36 game woods and 37 non-game woods and in East Anglia we surveyed 34 game and 32 non-game woods. During May and June we measured the length and width of all the rides in each wood (or within a 30-hectare plot for woods larger than this), conducted a butterfly survey of all rides and recorded plant species occurrence in 36 quadrats along the widest ride. In July and August, we surveyed butterflies and recorded the occurrence and structure of shrubs along the widest ride.
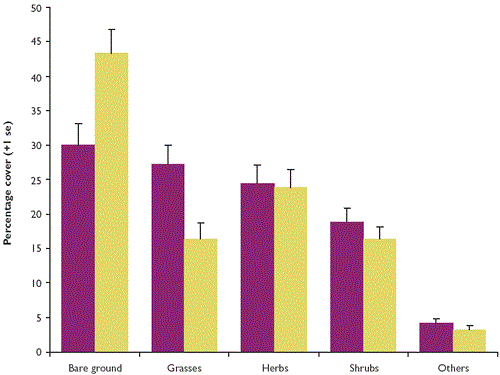
Figure 1: Comparison of bare ground and vegetation cover in rides within game and non-game woods on the Hampshire and South Wessex Downs

We found no statistical difference in the length of ride per hectare of woodland between game and non-game woods (134 ± 19 metres and 104 ± 12 metres respectively). On average, however, rides were wider in game woods than non-game woods (10.5 ± 0.6 metres and 8.8 ± 0.4 metres respectively). Consequently, rides comprised a higher proportion of the woodland area in game woods (12.6 ± 1.5%) than nongame woods (8.4 ± 0.9%). Rides in game woods were more open, with average canopy closure scores on a scale from 0 (open) to 1 (closed) of 0.45 ± 0.03 in game woods and 0.57 ± 0.03 in non-game woods. We found no overall difference in ride erosion scores between game and non-game woods, but disturbance by vehicles was 1.6 times higher in game woods, whereas erosion caused by horse riding and footpaths were 3.0 and 8.9 times higher respectively in non-game woods.
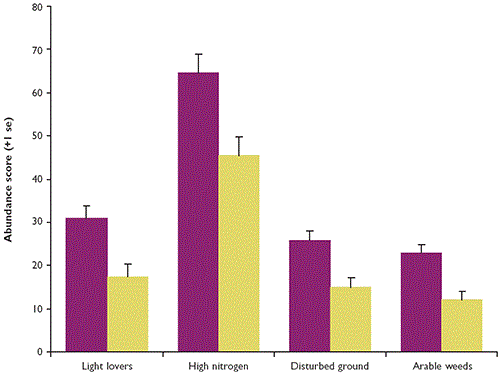
Further analyses of the large set of vegetation data are required, but here we present some preliminary findings based on information from the Hampshire and South Wessex Downs. Comparison of vegetation cover in rides revealed similar herb and shrub cover in game and non-game woods, but rides in game woods had 0.3 times less bare ground and 1.7 times more grass cover than those in non-game woods (see Figure 1). The number of herb species per four-square-metre quadrat was higher in game woods (29 ± 1) than non-game woods (24 ± 1). This was the result of slightly more characteristic woodland species, but also a greater abundance of species preferring high fertility and disturbed soil in game woods (see Figure 2). Abundance ranks of cleavers and docks were similar in game and non-game woods, but nettles and chickweed were more abundant in game woods.
In some cases it was apparent that disturbance resulting from ride management had led to a temporary flush of docks and thistles. However, wheat and barley volunteers and a few arable weeds, such as mayweed, regularly featured in rides in game woods, whereas arable weeds were only very occasional in non-game woods.
Figure 2: Comparison of herb species abundance in rides within game and non-game woods on the Hampshire and South Wessex Downs

Bramble and hazel were the two most common shrubs in rides in both game and non-game woods. Rides in non-game woods typically supported a greater number of shrub species (10 ± 0.4) than those in game woods (7 ± 0.4), but shrub abundance was very similar in both sets of woods. We found no differences in butterfly abundance or species richness between game and non-game woods in either spring or summer.
There was large variation in ride structure and species composition within our samples of both game and non-game woods. On average, however, it seems that rides in game woods are kept more open than those in non-game woods, but that driving into woods and feeding pheasants along rides results in the introduction of certain arable weeds. Incorporation of information from East Anglia, where wheat and barley volunteers were less common, and analyses including habitat management effects will provide a more complete picture.