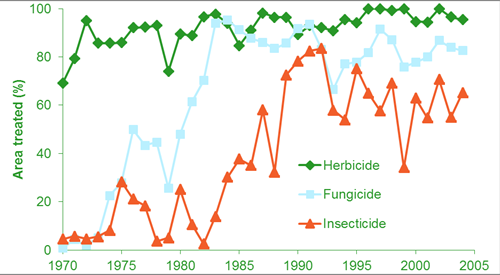
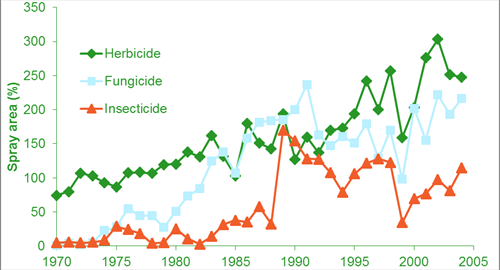
Information on the use of pesticides (foliar applications, including residual herbicides) in the arable crops on the Sussex study area has been collated and analysed over two time periods, 1970 to 1995 and again from 1996 to 2004. Except for the area treated with herbicides (already near to 100% by the beginning of the study) all measures of pesticide input across the Sussex Study area had increased when considering the time period of 1970 to 1995. There were no changes in area treated or in the intensity of treatments from 1996 to 2004 (Figures 1 and 2). It appeared that the early intensification in pesticide inputs in Sussex has stabilised. We also compared pesticide use on the Sussex study area to that reported nationally. Herbicide and fungicide use in Sussex from 1970 to 2004 matched that across the UK, whereas the intensity of their use was lower than nationally. Insecticide use and intensity were higher than nationally during the 1990s, but recent years (2002, 2004) were in line with national figures.
Figure 1: Trends through time in the arable area treated with the three major types of pesticides (herbicides, fungicides and insecticides)

Figure 2: Trends through time in percentage spray area, a measure of intensity of use which combines number of applications with the area treated

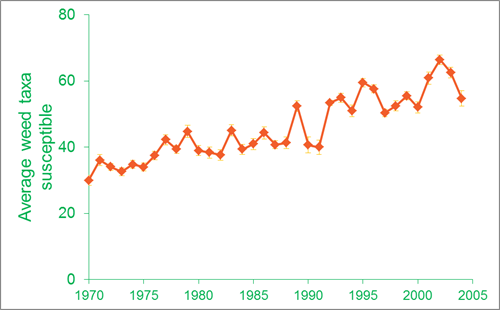
Figure 3: Change over time in the spectrum of efficacy of the herbicide regime applied to an arable field 1970-2004 on the Sussex study measured as the average number of weed groups classified as susceptible to the herbicide cocktail applied to a field

The detailed information on herbicide use has allowed us to look at changes in specificity of the herbicide cocktail that has been applied on the cereals in the study area. This has increased from 1970 to 2004 (Figure 3). The effects that changes in herbicide use and specificity have had on the arable flora on the Sussex study area are summarised here.
Further reading
- Ewald, J.A., Aebischer, N.J., Brickle, N.W., Moreby, S.J., Potts, G.R. & Wakeham-Dawson, A. 2002. Spatial variation in densities of farmland birds in relation to pesticide use and avian food resources. In: Chamberlain, D.E. & Wilson, A. (eds) Avian Landscape Ecology: Pure and Applied Issues in the Large-Scale Ecology of Birds: 305-312. International Association for Landscape Ecology (UK).
- Ewald, J.A. & Aebischer, N.J. 2000. Trends in pesticide use and efficacy during 26 years of changing agriculture in southern England. Environmental Monitoring and Assessment, 64: 493-529.
- Ewald, J.A. & Aebischer, N.J. 1999. Pesticide Use, Avian Food Resources and Bird Densities in Sussex. JNCC Report No. 296, Joint Nature Conservation Committee, Peterborough.
- Ewald, J.A., Aebischer, N.J. & Potts, G.R. 1998. Increasing Pesticide Use: Impacts on Wildlife Based on 30 years of Monitoring. In: Proceedings of the Wildlife, Pesticides, and People Conference, chapter 15: 1-16. Rachel Carson Council Inc, Fairfax, Virginia, USA.
- Potts, G.R. 1997. Cereal farming, pesticides and grey partridges. In: Pain, D.J. & Pienkowski, M.W. (eds) Farming and Birds in Europe: 150-177. Academic Press, London.