Key findings
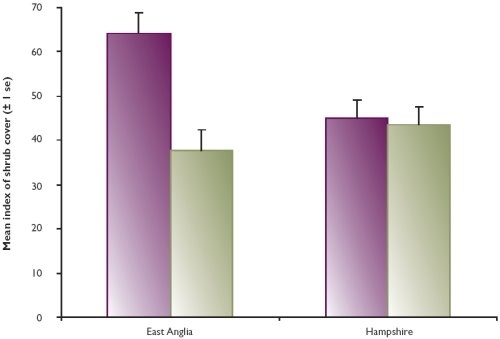
- The edges of woods managed for pheasants had a more sloping profile and 1.3 times greater shrub cover up to four metres high than non-game woods in East Anglia, but not in Hampshire.
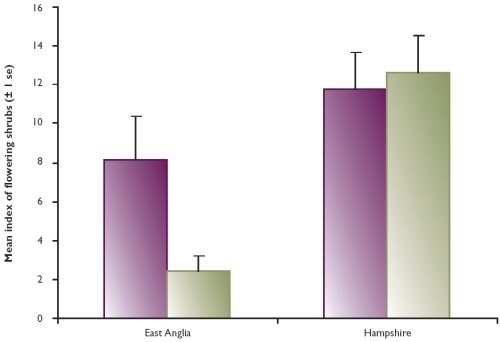
- There were 1.3 times more shrub species and 2.3 times more shrubs in flower at the edges of woods in Hampshire than in East Anglia, but game woods in East Anglia had 2.5 times as many flowering shrubs as non-game woods.
- Shrub density 10 metres inside the wood was 1.7 times higher in game woods than non-game woods in East Anglia, but not Hampshire.
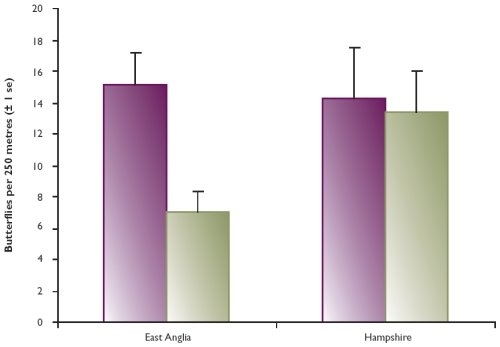
- Butterfly numbers were 2.2 times higher and the number of species 1.5 times higher at game woods than non-game woods in East Anglia, but not in Hampshire.
In 2004 we reported on the effects of pheasant releasing and management on vegetation structure and songbird numbers within woods. In this review we look at woodland edges. Specifically, we document differences in the diversity of shrub species, the amount of shrub cover and butterfly numbers resulting from pheasant management at the edges of semi-natural oak and ash woods. Pheasant density during winter and spring is affected by the amount of shrub cover, particularly along wood edges, and our advisors advocate creating graded, shrubby woodland edges to improve pheasant habitat.
We compared woods that contained pheasant release pens and had winter supplementary feeding, with ones that had no recent game management (within the last 25 years). In East Anglia, we surveyed 30 game woods and 29 non-game woods and on the Hampshire and South Wessex Downs we surveyed 41 game and 41 non-game woods. During July and August we recorded woodland edge profile, shrub species in five height categories and a measure of flowering shrubs at 50 points along a 250-metre section of south-facing edge at each wood. We also counted butterflies and bumblebees along this same section. Along each edge, we recorded the density of shrubs at 50 points in a 10-metre wide zone located 10 metres inside the wood.
Inside the woodland edge zone, we found that shrub density was 1.7 times higher for game than non-game woods in East Anglia, but we found no difference in Hampshire (see Figure 1). On average there was a greater number of shrub species in this zone in game woods than non-game woods (5.8 ± 0.3 compared with 4.6 ± 0.3) in both regions. Shrubs afforded more understorey cover at two to eight metres in game woods (50 ± 4%) than in non-game woods (40 ± 4%), and there was typically a denser understorey in Hampshire woods.
Figure 1: Shrub cover 10 metres inside woods

Viewed from outside, we found that game woods in East Anglia had a more sloping edge profile with fewer over-hanging trees than non-game woods, but found no difference in Hampshire. Overall shrub cover to a height of four metres along the wood margin was significantly greater for game woods (62%) than non-game woods (48%) in East Anglia, but not for Hampshire (both about 59%). There was no difference in the number of shrub species per sampling point between game and non-game woods, but there were 1.3 times more in Hampshire than in East Anglia.
In East Anglia, game woods had 2.5 times as many flowering shrubs as non-game woods (see Figure 2); the most common being bramble, clematis and honeysuckle. Total butterfly numbers followed the same pattern (see Figure 3), as did the number of different butterfly species (East Anglia averaged 4.0 species in game woods and 2.6 in non-game woods; Hampshire had 4.3 overall). We could detect no effect of game management on bumblebees in either region.
Figure 2: Shrubs flowering at woodland edges

Figure 3: Butterfly numbers at woodland edges

In East Anglia, woodland constitutes a smaller proportion of the landscape than in Hampshire, so perhaps game managers put greater effort into these smaller areas of woodland than in Hampshire. East Anglian shoots also rely more on wild pheasant production, so breeding habitat is more important than in Hampshire.